Market Outlook
November 28, 2017
Market Cues
Domestic Indices
Chg (%)
(Pts)
(Close)
Indian markets are likely to open negative tracking global indices and SGX Nifty.
BSE Sensex
0.1
45
33,724
U.S. Stocks showed a lack of direction over the course of the trading session on
Nifty
0.1
10
10,400
Monday following the strength seen last week. Indices closed mostly lower on
Mid Cap
0.5
88
17,022
Monday after touching intraday records as an early rally in retail shares largely
Small Cap
0.8
139
18,164
fizzled. However, the blue-chip Dow bucked the weak trend to eke out a gain. The
Dow inched up 0.1% to close at 23,581, the NASDAQ dipped 0.2% to finish at
Bankex
0.5
138
29,359
6,879 and the S&P 500 edged down less than a tenth of a percent to 2,601.
Global Indices
Chg (%)
(Pts)
(Close)
U.K. stocks ended lower on Monday for a third straight session as mining shares fell
under the weight of concerns about the health of Chinese companies. The FTSE 100
Dow Jones
0.1
23
23,581
index UKX, dropped 0.4% to close at 7,384.
Nasdaq
(0.2)
(11)
6,879
FTSE
(0.3)
(26)
7,384
On domestic front, shares recovered from an early slide to finish marginally higher
for the day despite mixed cues from global markets. Traders also kept an eye on oil
Nikkei
(0.2)
(55)
22,496
price movements ahead of a major meeting among oil producers on November 30.
Hang Seng
(0.6)
(180)
29,686
The benchmark BSE Sensex rose 0.13% to close at 33,724. While the broader Nifty
Shanghai Com
(0.9)
(32)
3,322
index ended the session up nearly 10 points to end at 10,400
Advances / Declines
BSE
NSE
News Analysis
Advances
1,574
1,021
ITC plans `10,000cr investment in food processing business
Declines
1,167
727
Detailed analysis on Pg2
Unchanged
156
82
Investor’s Ready Reckoner
Key Domestic & Global Indicators
Volumes (` Cr)
Stock Watch: Latest investment recommendations on 150+ stocks
BSE
4,087
Refer Pg5 onwards
NSE
27,083
Top Picks
CMP
Target
Upside
Net Inflows (` Cr)
Net
Mtd
Ytd
Company
Sector
Rating
(`)
(`)
(%)
FII
1,377
16,510
54,962
Blue Star
Capital Goods
Buy
722
867
20.1
MFs
2,326
3,825
99,236
Dewan Housing Finance
Financials
Accumulate
616
712
15.5
Asian Granito
Other
Buy
503
570
13.4
Navkar Corporation
Other
Buy
190
265
39.7
Top Gainers
Price (`)
Chg (%)
KEI Industries
Capital Goods Accumulate
360
380
5.6
Hathway
39
13.2
More Top Picks on Pg4
Ghcl
303
10.4
Key Upcoming Events
Religare
53
9.9
Previous
Consensus
Date
Region
Event Description
Tv18Brdcst
55
9.1
Reading
Expectations
Mindtree
550
7.4
Nov28
US
Consumer Confidence
125.90
124.00
Nov29
US
GDP Qoq (Annualised)
3.00
3.20
Nov29
Euro Zone Euro-Zone Consumer Confidence
0.10
0.10
Top Losers
Price (`)
Chg (%)
Nov30
US
Initial Jobless claims
239.00
240.00
Fretail
589
(8.4)
Nov30
Germany PMI Manufacturing
62.50
62.50
Lakshvilas
168
(6.6)
More Events on Pg7
Niittech
641
(2.6)
Edelweiss
285
(2.4)
Jswsteel
259
(2.4)
As on November, 27 2017
Market Outlook
November 28, 2017
News Analysis
ITC plans `10,000cr investment in food processing business
Cigarettes to fast-moving consumer goods (FMCG) firm ITC on Monday said it
would invest around ` 10,000cr in the coming years to strengthen its business in
the food processing sector. This is a part of the company’s `25,000cr-investment
package that it has planned to invest on 65 projects, including 20 integrated
factories for consumer goods across the country.
Recently, the Kolkata-based company forayed into the fruit and vegetables
segment with its Farmland brand of low-sugar potatoes. In the past, it has also
ventured into seafood and juice segments. “Nearly 58% of our revenues come
from the non-tobacco products; 80% of our capital employed is in the non-tobacco
sectors and 90% of our employees are in the non-tobacco areas,” he said.
By 2030, the company has targeted revenue of `1 lakh cr of which, FMCG is
expected to be one of the biggest contributors.
Corporate News
GMR Airports IPO likely by June 2019
NTPC power plants face Bhel equipment woes
L&T may sell some assets by March to fund acquisitions
Economic and Political News
15th Finance Commission to examine performance incentives for states
ST collection dips to ₹83,346cr in October
Textile exports may fall 10-12% in FY18
Market Outlook
November 28, 2017
Top Picks ★★★★★
Market Cap
CMP
Target
Upside
Company
Rationale
(` Cr)
(`)
(`)
(%)
Strong growth in domestic business due to its leade`hip
in acute therapeutic segment. Alkem expects to launch
Alkem Laboratories
23,638
1,977
2,125
7.5
more products in USA, which bodes for its international
business.
We expect the company would report strong profitability
Asian Granito
1,513
503
570
13.4
owing to better product mix, higher B2C sales and
amalgamation synergy.
Favorable outlook for the AC industry to augur well for
Cooling products business which is out pacing the
Blue Star
6,917
722
867
20.1
market growth. EMPPAC division's profitability to
improve once operating environment turns around.
With a focus on the low and medium income (LMI)
consumer segment, the company has increased its
Dewan Housing Finance
19,326
616
712
15.5
presence in tier-II & III cities where the growth
opportunity is immense.
Loan growth is likely to pick up after a sluggish FY17.
Lower credit cost will help in strong bottom-line growth.
Karur Vysya Bank
7,188
119
180
51.3
Increasing share of CASA will help in NIM
improvement.
High order book execution in EPC segment, rising B2C
KEI Industries
2,821
360
380
5.6
sales and higher exports to boost the revenues and
profitability
Expected to benefit from the lower capex requirement
Music Broadcast
2,127
373
434
16.4
and 15 year long radio broadcast licensing.
Massive capacity expansion along with rail advantage
Navkar Corporation
2,855
190
265
39.7
at ICD as well CFS augur well for the company
Strong brands and distribution network would boost
Siyaram Silk Mills
2,912
621
658
6.0
growth going ahead. Stock currently trades at an
inexpensive valuation.
Market leadership in Hindi news genre and no.
2
viewership ranking in English news genre, exit from the
TV Today Network
2,295
385
435
13.1
radio business, and anticipated growth in ad spends by
corporate to benefit the stock.
After GST, the company is expected to see higher
volumes along with improving product mix. The Gujarat
Maruti Suzuki
2,56,977
8,507
9,489
11.5
plant will also enable higher operating leverage which
will be margin accretive.
We expect loan book to grow at 24.3% over next two
GIC Housing
2,319
431
655
52.1
year; change in borrowing mix will help in NIM
improvement
We expect CPIL to report net Revenue/PAT CAGR of
~17%/16% over FY2017-20E mainly due to healthy
7,033
317
399
26
growth in plywood & lamination business, forayed into
Century Plyboards India
MDF & Particle boards on back of strong brand &
distribution network.
We expect sales/PAT to grow at 13.5%/20% over next
LT Foods
1875
70
96
37
two years on the back of strong distribution network &
addition of new products in portfolio.
Source: Company, Angel Research
Market Outlook
November 28, 2017
Key Upcoming Events
Global economic events release calendar
Bloomberg Data
Date
Time Country
Event Description
Unit
Period
Last Reported
Estimated
Nov 28, 2017
8:30 PMUS
Consumer Confidence
S.A./ 1985=100
Nov
125.90
124.00
Nov 29, 2017
7:00 PMUS
GDP Qoq (Annualised)
% Change
3Q S
3.00
3.20
3:30 PMEuro Zone
Euro-Zone Consumer Confidence
Value
Nov F
0.10
0.10
Nov 30, 2017
7:00 PMUS
Initial Jobless claims
Thousands
Nov 25
239.00
240.00
2:25 PMGermany
PMI Manufacturing
Value
Nov F
62.50
62.50
2:25 PMGermany
Unemployment change (000's)
Thousands
Nov
(11.00)
(10.00)
Dec 01, 2017
6:30 AMChina
PMI Manufacturing
Value
Nov
51.60
51.50
3:00 PMUK
PMI Manufacturing
Value
Nov
56.30
56.50
Dec 05, 2017
2:25 PMGermany
PMI Services
Value
Nov F
54.90
3:30 PMEuro Zone
Euro-Zone GDP s.a. (QoQ)
% Change
3Q F
0.60
Dec 06, 2017
2:30 PMIndia
RBI Reverse Repo rate
%
Dec 6
5.75
5.75
2:30 PMIndia
RBI Repo rate
%
Dec 6
6.00
6.00
2:30 PMIndia
RBI Cash Reserve ratio
%
Dec 6
4.00
4.00
Dec 08, 2017
3:00 PMUK
Industrial Production (YoY)
% Change
Oct
2.50
India
Imports YoY%
% Change
Nov
7.60
India
Exports YoY%
% Change
Nov
(1.10)
7:00 PMUS
Change in Nonfarm payrolls
Thousands
Nov
261.00
198.00
China
Exports YoY%
% Change
Nov
6.90
7:00 PMUS
Unnemployment rate
%
Nov
4.10
4.10
Dec 09, 2017
7:00 AMChina
Consumer Price Index (YoY)
% Change
Nov
1.90
Dec 12, 2017
5:30 PMIndia
Industrial Production YoY
% Change
Oct
3.80
3:00 PMUK
CPI (YoY)
% Change
Nov
3.00
US
Producer Price Index (mom)
% Change
Nov
0.20
Dec 13, 2017
3:00 PMUK
Jobless claims change
% Change
Nov
1.10
Source: Bloomberg, Angel Research
Market Outlook
November 28, 2017
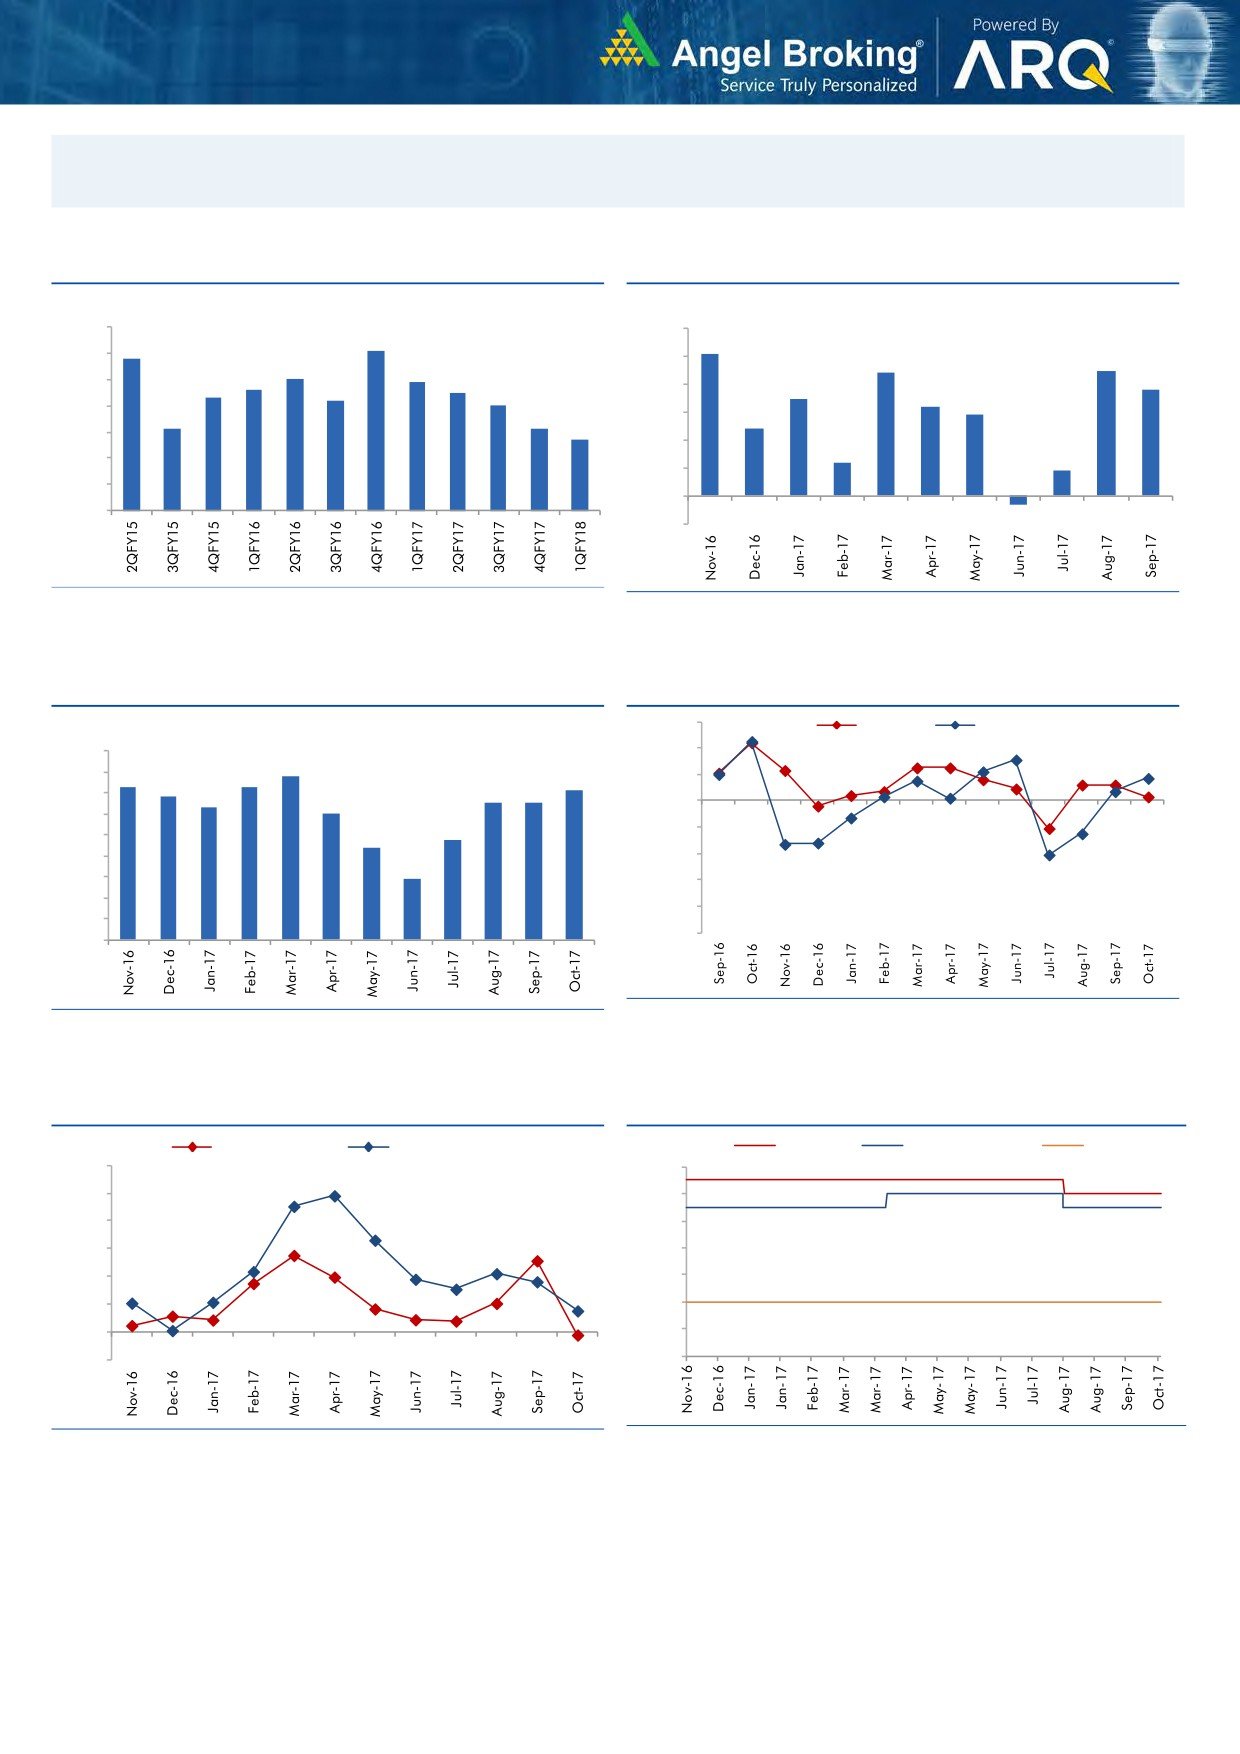
Macro watch
Exhibit 1: Quarterly GDP trends
Exhibit 2: IIP trends
(%)
(%)
10.0
6.0
9.1
5.1
8.8
9.0
5.0
4.4
4.5
8.0
7.9
7.6
7.5
3.8
8.0
7.3
7.2
4.0
3.5
7.0
3.2
2.9
7.0
6.1
6.1
3.0
2.4
5.7
6.0
2.0
1.2
0.9
5.0
1.0
4.0
-
3.0
(1.0)
(0.3)
Source: CSO, Angel Research
Source: MOSPI, Angel Research
Exhibit 3: Monthly CPI inflation trends
Exhibit 4: Manufacturing and services PMI
56.0
Mfg. PMI
Services PMI
(%)
4.5
54.0
3.9
4.0
3.6
3.7
3.6
52.0
3.4
3.3
3.3
3.5
3.2
3.0
50.0
3.0
2.4
48.0
2.5
2.2
2.0
46.0
1.5
1.5
44.0
1.0
42.0
0.5
40.0
-
Source: Market, Angel Research; Note: Level above 50 indicates expansion
Source: MOSPI, Angel Research
Exhibit 5: Exports and imports growth trends
Exhibit 6: Key policy rates
(%)
Exports yoy growth
Imports yoy growth
(%)
Repo rate
Reverse Repo rate
CRR
60.0
6.50
50.0
6.00
40.0
5.50
30.0
5.00
20.0
4.50
10.0
4.00
0.0
3.50
(10.0)
3.00
Source: Bloomberg, Angel Research
Source: RBI, Angel Research
Market Outlook
November 28, 2017
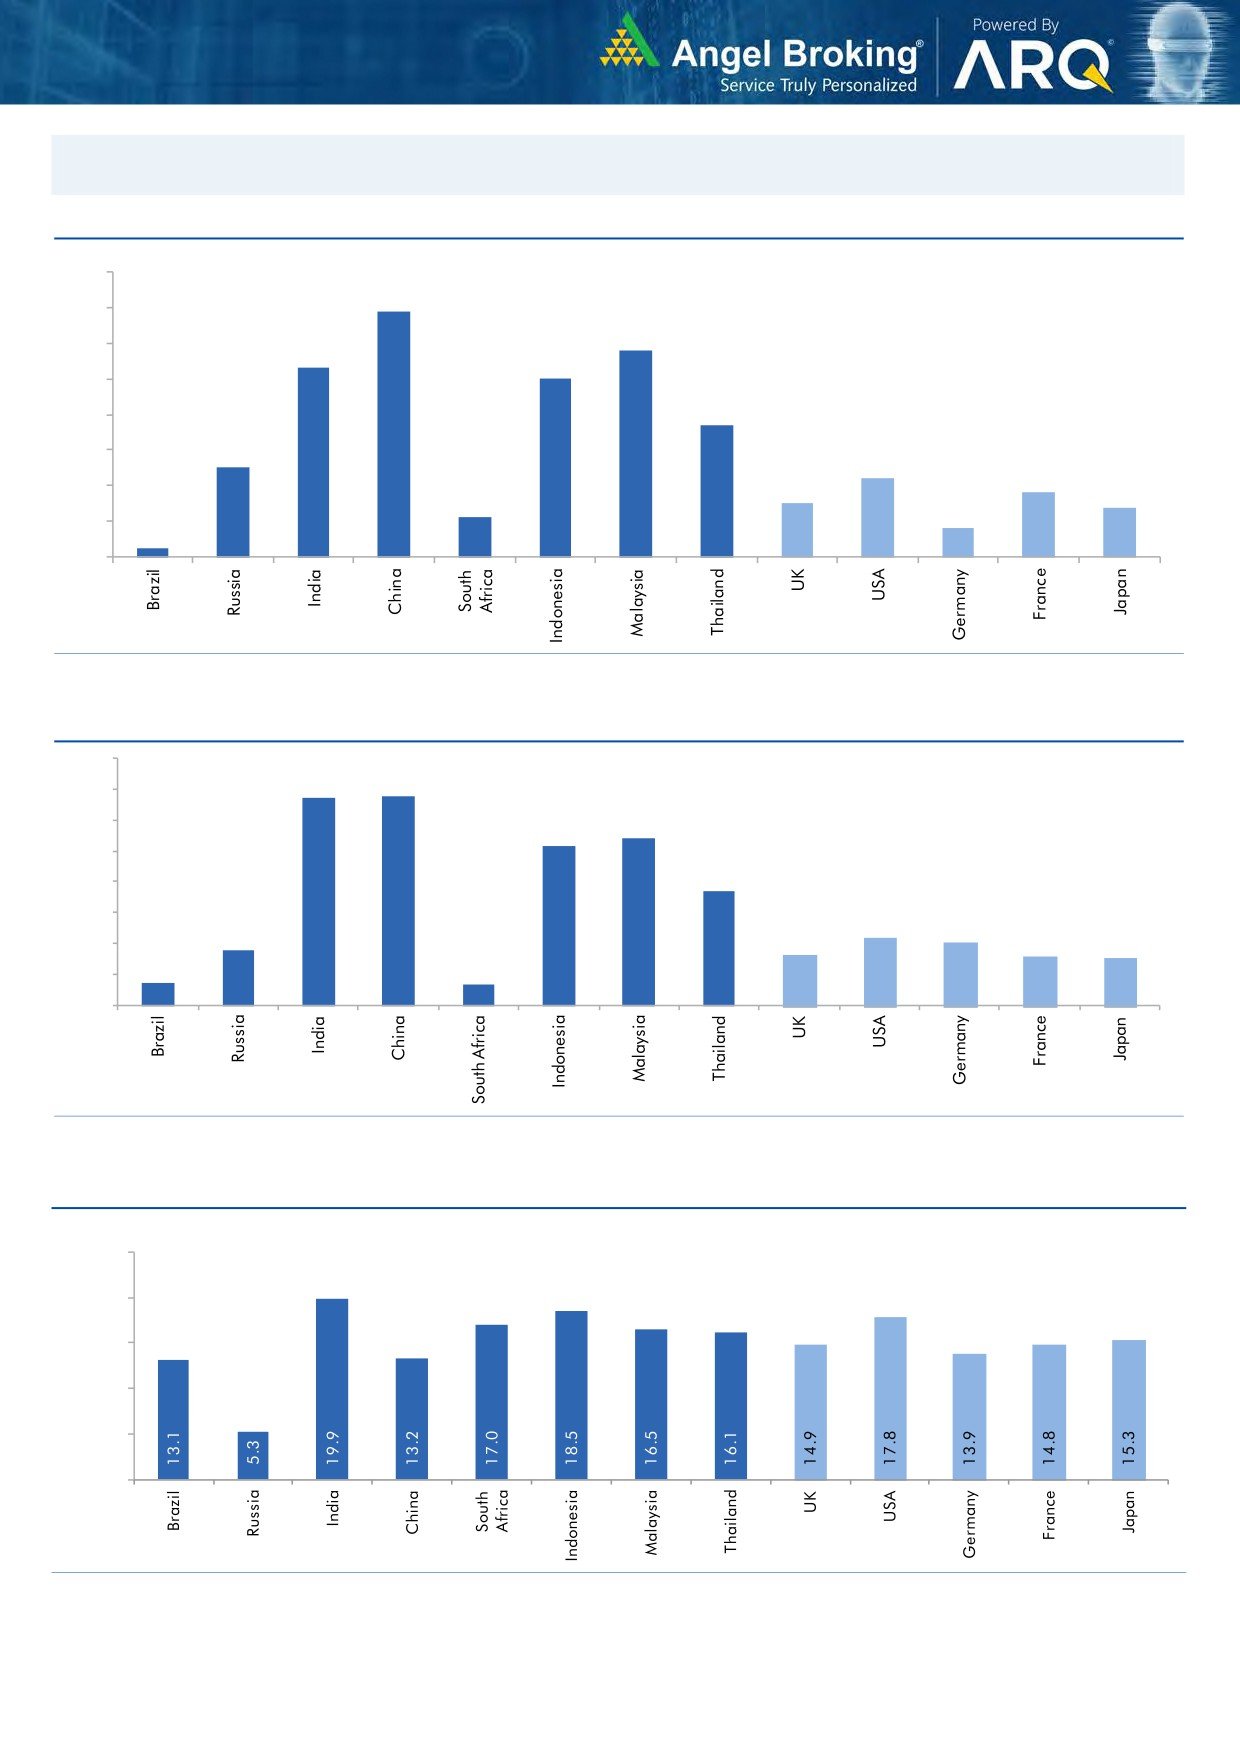
Global watch
Exhibit 1: Latest quarterly GDP Growth (%, yoy) across select developing and developed countries
(%)
8.0
6.9
7.0
5.8
6.0
5.3
5.0
5.0
1.1
3.7
4.0
2.5
3.0
2.2
1.8
2.0
1.5
1.4
0.8
1.0
0.3
-
Source: Bloomberg, Angel Research
Exhibit 2: 2017 GDP Growth projection by IMF (%, yoy) across select developing and developed countries
(%)
6.7
6.8
7.0
6.0
5.4
5.2
5.0
3.7
4.0
3.0
1.8
2.2
2.0
1.7
1.6
1.5
2.0
0.7
0.7
1.0
-
Source: IMF, Angel Research
Exhibit 3: One year forward P-E ratio across select developing and developed countries
(x)
25.0
20.0
15.0
10.0
5.0
-
Source: IMF, Angel Research
Market Outlook
November 28, 2017
Exhibit 4: Relative performance of indices across globe
Returns (%)
Country
Name of index
Closing price
1M
3M
1YR
Brazil
Bovespa
74,059
(1.8)
5.8
19.5
Russia
Micex
2,146
4.7
8.0
2.8
India
Nifty
10,400
0.5
5.5
30.6
China
Shanghai Composite
3,322
(3.0)
0.8
3.8
South Africa
Top 40
53,811
2.9
7.5
22.1
Mexico
Mexbol
47,275
(5.7)
(8.0)
4.2
Indonesia
LQ45
1,020
3.2
3.3
15.8
Malaysia
KLCI
1,720
(1.0)
(3.1)
5.7
Thailand
SET 50
1,085
(0.2)
8.1
18.1
USA
Dow Jones
23,581
1.1
8.1
23.5
UK
FTSE
7,384
(1.4)
0.6
9.0
Japan
Nikkei
22,496
3.2
15.8
25.2
Germany
DAX
13,000
0.4
6.8
22.2
France
CAC
5,360
(1.7)
6.5
17.2
Source: Bloomberg, Angel Research p68in4
Stock Watch
November 28, 2017
Company Name
Reco
CMP
Target
Mkt Cap
Sales ( Čcr )
OPM(%)
EPS (Č)
PER(x)
P/BV(x)
RoE(%)
EV/Sales(x)
(Č)
Price ( Č)
( Č cr )
FY18E FY19E
FY18E
FY19E
FY18E
FY19E
FY18E
FY19E
FY18E
FY19E
FY18E
FY19E
FY18E
FY19E
Agri / Agri Chemical
Rallis
Reduce
230
209
4,479
1,873
2,099
15.0
15.0
9.5
10.5
24.2
21.9
3.7
3.3
15.8
16.0
2.3
2.1
United Phosphorus
Accumulate
755
820
38,404
18,922
21,949
18.0
18.5
36.2
45.6
20.9
16.6
4.4
3.6
22.7
23.8
2.2
1.8
Auto & Auto Ancillary
Ashok Leyland
Neutral
124
-
36,194
23,339
27,240
10.1
10.8
4.7
6.2
26.6
19.9
5.3
4.7
20.0
23.6
1.5
1.3
Bajaj Auto
Neutral
3,272
-
94,691
23,936
27,955
19.5
20.1
142.7
167.3
22.9
19.6
5.0
4.5
21.8
22.8
3.5
3.0
Bharat Forge
Buy
702
875
32,673
7,637
8,755
21.7
23.2
36.1
47.3
19.4
14.9
3.5
3.0
18.5
20.8
4.1
3.5
Eicher Motors
Neutral
30,756
-
83,725
19,043
22,837
19.5
19.9
835.4
1,019.0
36.8
30.2
13.8
10.6
40.9
37.8
4.3
3.5
Gabriel India
Neutral
188
-
2,696
1,782
2,033
9.7
10.2
7.1
8.9
26.4
21.2
5.3
4.5
21.0
22.2
1.5
1.3
Hero Motocorp
Accumulate
3,655
4,129
72,987
32,239
36,878
16.0
15.6
184.4
206.5
19.8
17.7
6.2
5.5
31.3
30.7
2.0
1.8
Jamna Auto Industries Neutral
65
-
2,578
1,441
1,662
14.4
14.8
13.9
17.6
4.7
3.7
1.3
1.0
30.0
31.0
1.8
1.5
Mahindra and Mahindra Neutral
1,433
-
89,056
46,971
53,816
13.6
14.0
67.7
79.8
21.2
18.0
3.0
2.7
15.0
15.9
1.8
1.5
Maruti
Accumulate
8,507
9,489
256,977
79,470
95,208
15.9
17.2
281.7
363.8
30.2
23.4
6.6
5.3
21.7
22.8
2.9
2.3
Minda Industries
Neutral
1,189
-
10,274
4,328
5,084
11.0
11.9
27.3
36.4
43.6
32.7
9.2
7.2
23.1
25.6
2.5
2.1
Motherson Sumi
Neutral
362
-
76,281
55,937
64,445
10.8
11.4
16.9
21.1
21.4
17.2
4.8
4.9
25.2
25.4
1.4
1.2
Tata Motors
Neutral
421
-
121,601
303,167
343,649
11.8
13.8
33.1
54.7
12.7
7.7
2.1
1.7
16.9
23.0
0.5
0.4
TVS Motor
Neutral
745
-
35,406
13,992
16,216
9.0
9.4
17.1
20.3
43.7
36.7
11.6
9.0
29.7
27.7
2.5
2.1
Amara Raja Batteries
Accumulate
796
858
13,593
6,140
7,122
14.3
15.6
29.3
39.0
27.2
20.4
4.6
3.9
17.1
19.0
2.2
1.9
Exide Industries
Neutral
206
-
17,544
8,689
9,854
15.1
15.2
9.7
11.0
21.4
18.8
3.8
3.3
15.7
16.1
1.8
1.5
Apollo Tyres
Neutral
257
-
14,679
15,739
17,326
13.3
14.6
20.4
26.7
12.6
9.6
1.5
1.3
20.4
26.7
1.2
1.0
Ceat
Neutral
1,843
-
7,456
6,661
7,717
11.1
14.2
116.2
178.2
15.9
10.4
2.8
2.3
15.2
21.3
1.2
1.1
JK Tyres
Neutral
147
-
3,324
8,318
9,239
16.2
16.4
21.0
27.5
7.0
5.3
1.4
1.1
19.1
20.4
0.8
0.7
Swaraj Engines
Neutral
1,973
-
2,451
788
889
16.4
16.5
71.6
81.0
27.6
24.4
7.9
7.4
29.6
31.0
2.8
2.4
Subros
Neutral
263
-
1,579
1,855
2,135
11.6
11.8
10.3
14.7
25.7
18.0
3.9
3.3
15.8
19.1
1.1
0.9
Capital Goods
BEML
Neutral
1,693
-
7,049
4,286
5,194
7.1
8.2
42.9
58.1
39.5
29.1
3.2
2.9
7.6
8.7
1.7
1.4
Bharat Electronics
Neutral
186
-
45,774
10,258
12,470
19.6
19.5
7.3
8.6
25.5
21.7
0.5
0.4
20.4
21.9
4.0
3.2
Voltas
Neutral
648
-
21,433
6,778
8,004
9.6
11.0
17.1
22.4
37.9
28.9
9.0
7.9
17.7
19.8
2.9
2.4
BHEL
Neutral
92
-
33,795
33,200
39,167
6.8
9.5
6.2
11.2
14.9
8.2
0.7
0.7
4.6
8.0
0.6
0.5
Blue Star
Buy
722
867
6,917
5,220
6,207
6.3
6.6
16.8
22.3
43.0
32.4
8.5
7.5
19.9
23.3
1.3
1.1
CG Power and Industrial
Neutral
87
-
5,462
6,555
7,292
7.5
7.5
-
0.8
8,715.0
108.9
1.4
1.4
0.1
1.2
0.9
0.8
Solutions
Greaves Cotton
Neutral
121
-
2,951
1,778
1,993
14.7
15.1
8.1
9.1
14.9
13.3
3.4
3.1
21.8
23.6
1.4
1.3
Stock Watch
November 28, 2017
Company Name
Reco
CMP
Target
Mkt Cap
Sales ( Čcr )
OPM(%)
EPS (Č)
PER(x)
P/BV(x)
RoE(%)
EV/Sales(x)
(Č)
Price ( Č)
( Č cr )
FY18E FY19E
FY18E
FY19E
FY18E
FY19E
FY18E
FY19E
FY18E
FY19E
FY18E
FY19E
FY18E
FY19E
Capital Goods
KEC International
Accumulate
330
350
8,483
9,779
11,113
9.4
9.8
14.2
18.2
23.2
18.1
4.5
3.7
21.1
22.1
1.1
1.0
KEI Industries
Accumulate
360
380
2,821
3,001
3,391
10.0
10.0
13.0
16.1
27.7
22.3
5.0
4.2
18.2
18.7
1.1
1.0
Thermax
Neutral
1,044
-
12,437
4,125
4,747
10.3
10.8
26.7
31.5
39.1
33.1
4.4
4.0
11.2
12.0
2.7
2.4
VATech Wabag
Buy
583
681
3,181
3,867
4,126
9.6
10.0
34.9
39.8
16.7
14.6
2.8
2.4
17.7
17.5
0.8
0.8
Cement
ACC
Neutral
1,694
-
31,802
12,255
13,350
13.5
14.3
58.0
66.2
29.2
25.6
3.5
3.2
11.5
12.2
2.6
2.4
Ambuja Cements
Neutral
262
-
52,103
10,250
11,450
17.5
19.0
7.2
8.3
36.4
31.6
2.6
2.5
7.0
7.8
4.9
4.3
India Cements
Neutral
179
-
5,508
6,135
6,750
14.8
15.2
8.5
11.5
21.0
15.5
1.0
1.0
4.8
6.2
1.2
1.1
JK Cement
Neutral
991
-
6,930
4,150
4,775
19.2
20.0
49.0
63.5
20.2
15.6
3.2
2.8
17.0
18.5
2.1
1.8
J K Lakshmi Cement
Neutral
409
-
4,814
3,422
3,757
15.5
17.0
13.5
23.2
30.3
17.6
3.2
2.7
10.8
15.5
1.8
1.6
Orient Cement
Neutral
164
-
3,358
2,215
3,233
16.8
17.0
5.9
6.9
27.8
23.8
2.1
2.0
10.8
10.1
2.5
1.7
UltraTech Cement
Neutral
4,263
-
117,048
28,250
35,150
20.2
23.5
77.5
122.2
55.0
34.9
4.6
4.2
9.6
14.8
4.6
3.7
Construction
KNR Constructions
Neutral
281
-
3,945
1,846
2,203
14.5
14.5
12.1
13.7
23.2
20.6
1.3
1.1
17.5
16.7
2.2
1.8
Larsen & Toubro
Neutral
1,223
-
171,290
95,787
109,476
10.2
11.6
44.5
50.8
27.5
24.1
3.4
3.2
12.9
13.1
2.3
2.1
Gujarat Pipavav Port
Neutral
151
-
7,319
739
842
61.6
62.7
5.1
6.2
29.7
24.6
3.7
3.6
12.7
14.9
9.4
8.1
PNC Infratech
Neutral
188
-
4,829
2,040
2,935
13.0
13.0
6.4
9.0
29.4
20.9
0.8
0.7
9.7
12.2
2.4
1.7
Simplex Infra
Neutral
540
-
2,672
6,012
6,619
11.6
11.7
21.1
31.0
25.7
17.5
1.8
1.6
6.5
8.6
1.0
0.9
Sadbhav Engineering
Neutral
372
-
6,376
3,823
4,426
10.7
10.8
10.3
11.8
36.1
31.5
4.3
3.8
10.1
10.5
2.0
1.7
NBCC
Neutral
264
-
23,751
9,099
12,706
6.4
6.4
7.3
9.6
36.3
27.6
1.6
1.3
27.5
30.5
2.5
1.8
MEP Infra
Neutral
102
-
1,662
2,403
2,910
18.3
16.8
2.4
6.1
43.5
16.8
16.5
11.1
35.2
55.8
1.8
1.5
SIPL
Neutral
134
-
4,734
2,060
2,390
46.8
47.7
(5.8)
(3.1)
5.0
5.7
(14.2)
(2.3)
7.1
6.6
Engineers India
Neutral
183
-
12,339
1,795
2,611
21.1
22.4
5.9
8.1
31.0
22.6
2.2
2.1
12.9
16.1
5.3
3.4
Financials
Axis Bank
Neutral
560
-
134,210
32,558
35,843
3.5
3.2
27.8
41.0
20.1
13.6
2.2
1.9
11.4
14.9
-
-
Bank of Baroda
Neutral
175
-
40,403
22,533
26,079
2.4
2.4
12.0
20.9
14.6
8.4
1.0
0.9
6.6
11.0
-
-
Canara Bank
Neutral
387
-
23,121
17,925
20,235
2.0
2.1
18.5
36.5
20.9
10.6
0.8
0.7
3.4
6.2
-
-
Can Fin Homes
Neutral
474
-
6,305
586
741
3.5
3.5
107.8
141.0
4.4
3.4
1.0
0.8
24.1
25.6
-
-
Cholamandalam Inv. &
Neutral
1,269
-
19,833
2,826
3,307
6.3
6.3
53.7
64.6
23.7
19.7
4.0
3.4
18.3
18.9
-
-
Fin. Co.
Dewan Housing Finance Buy
616
712
19,326
2,676
3,383
2.4
2.7
37.4
49.7
16.5
12.4
2.2
1.9
13.8
16.2
-
-
Equitas Holdings
Buy
146
235
4,953
1,125
1,380
9.6
9.8
1.5
6.0
97.3
24.3
2.2
2.1
2.4
8.2
-
-
Federal Bank
Accumulate
112
125
22,035
4,896
5,930
2.8
3.1
5.4
7.6
20.9
14.8
1.8
1.6
8.5
11.0
-
-
Stock Watch
November 28, 2017
Company Name
Reco
CMP
Target
Mkt Cap
Sales ( Čcr )
OPM(%)
EPS (Č)
PER(x)
P/BV(x)
RoE(%)
EV/Sales(x)
(Č)
Price ( Č)
( Č cr )
FY18E FY19E
FY18E
FY19E
FY18E
FY19E
FY18E
FY19E
FY18E
FY19E
FY18E
FY19E
FY18E
FY19E
Financials
GIC Housing
Buy
431
655
2,319
376
477
3.6
3.7
33.0
40.0
13.1
10.8
2.3
2.0
20.0
23.0
-
-
HDFC Bank
Neutral
1,859
-
480,773
55,236
63,253
4.5
4.4
68.9
82.4
27.0
22.6
4.7
3.9
18.7
18.5
-
-
ICICI Bank
Neutral
317
-
203,486
42,361
51,378
3.6
3.9
18.4
25.7
17.3
12.3
1.9
1.8
11.3
15.0
-
-
Karur Vysya Bank
Buy
119
180
7,188
3,289
3,630
3.7
3.9
10.8
14.1
11.0
8.5
1.3
1.2
12.5
14.7
-
-
LIC Housing Finance
Accumulate
596
630
30,083
4,895
6,332
3.4
3.7
50.7
66.8
11.8
8.9
2.3
1.9
21.7
23.8
-
-
Punjab Natl.Bank
Neutral
186
-
39,559
23,708
25,758
2.1
2.1
5.9
16.4
31.6
11.3
0.9
0.9
3.0
8.3
-
-
RBL Bank
Neutral
515
-
21,448
2,309
2,888
2.6
2.5
16.4
19.1
31.5
27.0
4.0
3.5
13.3
13.8
-
-
Repco Home Finance
Buy
622
825
3,893
496
597
4.4
4.2
38.5
48.7
16.2
12.8
2.9
2.4
19.6
20.6
-
-
South Ind.Bank
Neutral
31
-
5,670
3,195
3,567
3.0
3.1
3.0
3.8
10.4
8.2
1.0
0.9
10.5
11.9
-
-
St Bk of India
Neutral
335
-
289,390
105,827
121,056
2.4
2.5
16.1
25.6
20.8
13.1
1.6
1.5
6.6
9.9
-
-
Union Bank
Neutral
168
-
12,200
14,650
16,225
2.3
2.3
23.1
32.5
7.3
5.2
0.6
0.5
7.1
9.2
-
-
Yes Bank
Neutral
315
-
72,310
11,088
13,138
3.0
2.9
84.0
99.3
3.8
3.2
0.6
0.5
16.3
16.8
-
-
FMCG
Akzo Nobel India
Neutral
1,817
-
8,714
3,164
3,607
13.8
13.7
58.6
67.9
31.0
26.8
7.6
6.7
24.5
25.1
2.6
2.3
Asian Paints
Neutral
1,158
-
111,094
17,603
20,615
18.6
18.6
2,128.9
2,543.3
0.5
0.5
11.5
9.7
28.0
28.9
6.1
5.1
Britannia
Neutral
4,792
-
57,530
9,690
11,278
14.8
15.4
84.0
101.0
57.1
47.4
20.8
16.5
40.6
39.0
5.9
5.1
Colgate
Neutral
1,058
-
28,783
4,420
5,074
24.9
25.3
28.6
32.8
37.0
32.3
14.6
11.8
43.8
40.5
6.3
5.4
Dabur India
Neutral
342
-
60,174
8,346
9,344
19.6
19.9
7.8
9.0
43.8
38.0
8.8
8.0
25.2
24.8
6.8
6.0
GlaxoSmith Con*
Neutral
6,043
-
25,413
5,072
5,760
18.2
18.4
176.3
199.2
34.3
30.3
7.3
6.6
21.2
21.7
4.3
3.8
Godrej Consumer
Neutral
948
-
64,597
10,171
11,682
20.8
21.5
21.7
27.1
43.7
35.0
9.8
8.4
22.3
23.4
6.5
5.6
HUL
Neutral
1,261
-
272,833
37,077
41,508
20.3
21.8
5,189.9
6,318.5
0.2
0.2
38.4
32.8
74.8
82.0
7.2
6.4
ITC
Neutral
259
-
315,848
44,588
49,853
37.0
37.3
9.6
11.0
27.0
23.6
6.6
6.3
25.1
27.3
6.6
5.8
Marico
Neutral
311
-
40,169
6,788
7,766
18.5
19.2
7.1
8.5
43.8
36.6
15.3
13.1
36.9
38.0
5.8
5.0
Nestle*
Neutral
7,503
-
72,344
10,083
11,182
20.0
20.9
119.7
141.3
62.7
53.1
220.9
201.9
36.7
39.8
6.9
6.1
Tata Global
Neutral
277
-
17,511
7,121
7,641
11.9
12.3
6.9
8.0
40.2
34.7
2.7
2.6
6.8
7.2
2.3
2.1
Procter & Gamble
Neutral
9,100
-
29,539
3,034
3,579
27.1
27.7
167.7
198.8
54.3
45.8
14.6
12.5
28.8
29.5
9.2
7.7
Hygiene
IT
HCL Tech^
Buy
861
1,014
122,857
50,009
54,608
22.1
22.1
62.8
67.6
13.7
12.7
3.1
2.6
22.4
20.6
2.1
1.8
Infosys
Accumulate
998
1,120
229,125
70,333
75,960
26.0
26.0
61.7
65.9
16.2
15.1
3.1
2.8
18.9
18.7
2.7
2.4
TCS
Reduce
2,687
2,442
514,379
123,384
134,488
26.1
26.1
133.2
143.7
20.2
18.7
5.6
5.2
27.6
27.8
3.8
3.5
Tech Mahindra
Accumulate
498
526
48,639
30,545
32,988
15.0
15.0
35.2
37.6
14.2
13.3
2.4
2.2
16.8
16.2
1.4
1.2
Stock Watch
November 28, 2017
Company Name
Reco
CMP
Target
Mkt Cap
Sales ( Čcr )
OPM(%)
EPS (Č)
PER(x)
P/BV(x)
RoE(%)
EV/Sales(x)
(Č)
Price ( Č)
( Č cr )
FY18E FY19E
FY18E
FY19E
FY18E
FY19E
FY18E
FY19E
FY18E
FY19E
FY18E
FY19E
FY18E
FY19E
IT
Wipro
Neutral
295
-
143,470
54,164
56,544
22.3
22.3
18.8
19.5
15.7
15.1
2.5
2.2
15.0
13.6
1.9
1.6
Media
D B Corp
Neutral
368
-
6,768
2,404
2,625
30.5
31.5
23.7
26.9
15.5
13.7
3.7
3.1
23.5
22.8
2.7
2.4
HT Media
Neutral
102
-
2,376
2,589
2,830
15.1
15.4
8.3
10.9
12.3
9.4
1.0
0.9
8.4
10.4
0.5
0.3
Jagran Prakashan
Buy
166
225
5,160
2,541
2,835
28.5
28.7
12.7
14.1
13.1
11.8
2.7
2.3
21.3
21.4
1.9
1.6
Sun TV Network
Neutral
885
-
34,857
3,238
3,789
51.9
55.1
30.9
38.0
28.6
23.3
8.2
7.2
30.0
31.0
10.3
8.7
Hindustan Media
Neutral
251
-
1,843
1,002
1,074
23.3
23.5
29.2
33.8
8.6
7.4
1.3
1.1
15.6
15.4
0.8
0.6
Ventures
TV Today Network
Accumulate
385
435
2,295
667
727
27.7
27.7
18.6
20.1
20.7
19.2
3.2
3.3
15.6
17.3
3.0
2.8
Music Broadcast Limited Buy
373
434
2,127
271
317
91.0
109.0
6.0
10.0
62.1
37.3
3.9
3.5
6.5
9.3
7.4
6.1
Metals & Mining
Coal India
Neutral
272
-
168,748
82,301
91,235
17.0
18.0
17.1
20.5
15.9
13.3
3.0
2.8
45.0
55.0
1.7
1.5
Hind. Zinc
Neutral
306
-
129,168
22,108
24,555
57.0
58.0
22.1
26.3
13.8
11.6
4.5
3.6
32.0
35.0
4.8
4.0
Hindalco
Neutral
250
-
56,074
102,350
105,355
13.5
14.5
21.5
24.5
11.6
10.2
1.6
1.4
15.0
15.2
1.1
1.1
JSW Steel
Neutral
259
-
62,582
64,500
68,245
21.1
21.5
20.1
21.2
12.9
12.2
2.4
2.0
-
-
1.7
1.6
NMDC
Neutral
126
-
39,928
10,209
11,450
47.0
48.0
11.1
12.1
11.4
10.4
1.6
1.5
-
-
3.4
3.1
SAIL
Neutral
82
-
33,764
54,100
63,555
3.0
10.0
(10.0)
1.5
54.5
1.1
1.1
-
-
1.6
1.4
Vedanta
Neutral
305
-
113,467
81,206
87,345
28.0
29.0
26.5
33.5
11.5
9.1
2.6
2.3
-
-
2.1
1.8
Tata Steel
Neutral
702
-
68,165
121,445
126,500
16.2
17.2
65.4
81.3
10.7
8.6
1.7
1.5
-
-
1.1
1.0
Oil & Gas
GAIL
Neutral
466
-
78,891
53,115
52,344
14.2
15.3
30.0
31.1
15.6
15.0
1.9
1.8
-
-
1.2
1.2
ONGC
Neutral
183
-
235,426
83,111
84,934
44.2
44.9
16.4
16.9
11.2
10.9
1.4
1.3
-
-
2.7
2.7
Indian Oil Corp
Neutral
393
-
190,643
396,116
432,560
8.5
8.8
40.1
42.2
9.8
9.3
1.7
1.5
-
-
0.6
0.6
Reliance Industries
Neutral
951
-
618,316
257,711
267,438
17.0
18.2
89.1
89.5
10.7
10.6
1.0
0.9
-
-
2.1
2.0
Pharmaceuticals
Alembic Pharma
Buy
513
600
9,673
3,346
3,915
19.6
19.2
21.0
23.9
24.4
21.5
4.3
3.7
19.1
18.4
2.9
2.5
Alkem Laboratories Ltd
Accumulate
1,977
2,125
23,638
6,320
7,341
17.5
19.8
72.7
96.6
27.2
20.5
4.8
4.1
16.7
18.7
3.7
3.1
Aurobindo Pharma
Accumulate
719
823
42,140
17,086
19,478
22.1
22.0
44.7
51.4
16.1
14.0
3.6
2.9
24.7
22.7
2.6
2.3
Aventis*
Neutral
4,431
-
10,205
2,411
2,698
18.8
18.8
151.6
163.9
29.2
27.0
4.5
3.7
25.4
27.5
3.8
3.2
Cadila Healthcare
Reduce
444
411
45,470
11,365
12,926
20.0
20.0
18.4
20.5
24.1
21.7
5.3
4.4
24.3
22.2
4.1
3.5
Cipla
Sell
615
462
49,497
16,163
18,711
16.6
16.9
20.7
24.3
29.7
25.3
3.5
3.1
12.6
13.1
3.2
2.7
Dr Reddy's
Reduce
2,297
2,040
38,089
13,734
15,548
17.7
20.2
69.9
102.0
32.9
22.5
2.9
2.7
9.2
12.4
3.0
2.6
GSK Pharma*
Sell
2,482
2,000
21,025
2,968
3,324
13.8
15.9
37.8
46.3
65.7
53.6
11.5
12.6
16.7
22.4
6.9
6.3
Indoco Remedies
Sell
285
136
2,623
1,114
1,297
9.9
13.9
5.6
11.4
50.8
25.0
3.9
3.4
7.7
14.5
2.6
2.2
Stock Watch
November 28, 2017
Company Name
Reco
CMP
Target
Mkt Cap
Sales ( Čcr )
OPM(%)
EPS (Č)
PER(x)
P/BV(x)
RoE(%)
EV/Sales(x)
(Č)
Price ( Č)
( Č cr )
FY18E FY19E
FY18E
FY19E
FY18E
FY19E
FY18E
FY19E
FY18E
FY19E
FY18E
FY19E
FY18E
FY19E
Pharmaceuticals
Ipca labs
Accumulate
533
570
6,730
3,256
3,647
14.1
17.1
16.2
25.4
32.9
21.0
2.5
2.3
8.0
11.5
2.1
1.9
Lupin
Buy
831
1,091
37,563
16,240
18,562
21.3
21.7
42.5
49.6
19.6
16.8
2.5
2.2
13.3
13.7
2.4
2.0
Natco Pharma
Accumulate
932
1,057
16,265
1,886
2,016
32.3
29.5
23.2
22.0
40.3
42.3
8.4
7.5
20.9
17.6
8.5
7.9
Sun Pharma
Accumulate
550
615
132,019
28,312
31,826
20.7
22.4
18.5
22.3
29.7
24.7
3.4
3.1
11.5
14.0
4.3
3.7
Syngene International
Accumulate
520
556
10,399
1,394
1,818
33.0
36.0
15.8
20.6
32.9
25.2
6.1
5.0
18.6
20.0
7.4
5.7
Power
Tata Power
Neutral
95
-
25,763
32,547
33,806
20.5
20.5
4.7
5.4
20.3
17.8
1.9
1.7
10.5
10.5
1.8
1.7
NTPC
Neutral
186
-
153,407
86,070
101,246
28.3
30.7
12.9
16.2
14.4
11.5
1.5
1.4
10.6
12.4
3.1
2.8
Power Grid
Accumulate
210
223
109,811
29,183
32,946
89.7
90.0
18.0
20.8
11.7
10.1
2.0
1.7
17.7
18.2
7.7
7.1
Real Estate
Prestige Estate
Neutral
310
-
11,642
4,607
5,146
21.0
22.2
7.9
9.8
39.3
31.7
2.4
2.2
10.3
12.0
3.7
3.4
MLIFE
Accumulate
483
522
2,477
487
590
12.3
17.8
21.0
31.2
23.0
15.5
1.2
1.1
5.2
7.4
3.8
3.1
Telecom
Bharti Airtel
Neutral
498
-
199,130
97,903
105,233
36.0
36.3
9.3
11.1
53.6
45.1
2.6
2.4
5.0
5.6
3.0
2.7
Idea Cellular
Neutral
96
-
34,720
35,012
37,689
27.1
27.7
(4.4)
(2.7)
1.5
1.6
(6.8)
(4.6)
2.3
2.1
zOthers
Abbott India
Neutral
5,039
-
10,708
3,244
3,723
14.9
16.1
167.5
209.4
30.1
24.1
6.6
5.5
23.7
24.8
3.0
2.5
Asian Granito
Accumulate
503
570
1,513
1,169
1,286
12.5
12.5
16.0
19.7
31.5
25.5
3.4
3.0
10.7
11.6
1.5
1.4
Bajaj Electricals
Neutral
490
-
4,986
4,646
5,301
6.7
7.6
16.1
22.3
30.5
22.0
5.0
4.2
16.4
19.2
1.1
0.9
Banco Products (India)
Neutral
242
-
1,733
1,530
1,695
13.2
12.7
19.0
20.0
12.8
12.1
2.0
1.8
0.2
0.2
1.0
116.4
Coffee Day Enterprises
Neutral
236
-
4,860
3,494
3,913
17.4
18.0
4.8
5.7
-
41.4
2.1
2.0
-
0.1
1.9
1.6
Ltd
Elecon Engineering
Neutral
77
-
865
171
201
15.0
16.2
36.0
43.0
2.1
1.8
0.2
0.2
0.1
0.1
4.4
3.8
Garware Wall Ropes
Neutral
904
-
1,979
928
1,003
15.2
15.2
39.4
43.2
22.9
21.0
3.8
3.2
16.5
15.4
2.0
1.8
Goodyear India*
Neutral
889
-
2,050
1,717
1,866
11.8
12.3
47.9
49.8
18.5
17.9
2.9
2.5
15.6
15.7
0.9
127.4
Hitachi
Neutral
2,614
-
7,107
2,355
2,715
10.3
10.8
49.0
60.9
53.3
42.9
12.5
9.9
0.2
0.2
3.1
2.6
HSIL
Neutral
528
-
3,816
2,240
2,670
14.6
15.0
17.0
22.0
31.1
24.0
2.6
2.4
0.1
0.1
1.9
1.6
Interglobe Aviation
Neutral
1,169
-
44,913
22,570
27,955
14.2
15.0
63.6
81.8
18.4
14.3
9.7
8.2
0.5
0.6
1.7
1.3
Jyothy Laboratories
Neutral
386
-
7,015
1,781
2,044
14.1
15.0
9.4
10.5
41.3
36.8
8.8
8.3
0.2
0.2
4.2
3.6
Linc Pen & Plastics
Neutral
279
-
412
420
462
9.3
9.3
15.3
17.1
18.2
16.3
3.1
3.2
16.9
19.5
1.0
0.9
M M Forgings
Neutral
870
-
1,050
542
642
20.1
21.0
41.6
56.8
20.9
15.3
2.9
2.4
0.1
0.2
2.4
2.1
Mirza International
Neutral
162
-
1,953
1,148
1,285
18.0
18.0
8.0
9.4
20.2
17.4
3.4
2.8
16.3
16.1
1.9
1.6
Navkar Corporation
Buy
190
265
2,855
561
617
41.5
41.5
11.5
12.7
16.5
14.9
1.7
1.6
10.5
10.4
5.8
5.0
Nilkamal
Neutral
1,794
-
2,678
2,317
2,525
11.4
11.1
96.0
105.0
18.7
17.1
3.2
2.8
0.2
0.2
1.1
1.0
Stock Watch
November 28, 2017
Company Name
Reco
CMP
Target Mkt Cap
Sales ( Čcr )
OPM(%)
EPS (Č)
PER(x)
P/BV(x)
RoE(%)
EV/Sales(x)
(Č)
Price ( Č)
( Č cr )
FY18E FY19E FY18E FY19E FY18E FY19E FY18E FY19E FY18E FY19E FY18E FY19E FY18E FY19E
zOthers
Parag Milk Foods
Neutral
237
-
1,996
1,987
2,379
7.6
9.0
12.4
18.3
19.1
13.0
2.7
2.4
8.2
13.2
1.1
1.0
Radico Khaitan
Neutral
287
-
3,820
1,811
1,992
13.2
13.2
8.1
8.8
35.4
32.6
3.6
3.9
10.1
12.0
2.4
2.2
Relaxo Footwears
Neutral
619
-
7,446
1,981
2,310
13.7
14.5
12.0
15.5
51.6
39.9
10.0
8.1
0.2
0.2
3.8
3.3
Siyaram Silk Mills
Neutral
621
-
2,912
1,769
1,981
12.7
12.7
22.6
26.2
27.5
23.7
4.3
3.7
15.5
15.5
1.8
1.6
Styrolution ABS India* Neutral
1,013
-
1,781
1,800
1,980
8.0
8.1
42.0
46.2
24.1
21.9
2.7
2.4
0.1
0.1
1.1
1.0
Surya Roshni
Neutral
396
-
1,735
4,870
5,320
7.7
7.8
22.8
28.1
17.4
14.1
2.3
2.0
0.1
0.1
0.6
0.5
TVS Srichakra
Neutral
3,303
-
2,529
2,729
2,893
12.7
12.5
248.5
265.0
13.3
12.5
3.8
3.1
0.3
0.3
0.9
0.9
Visaka Industries
Neutral
591
-
939
1,104
1,214
12.1
12.6
31.0
37.9
19.1
15.6
2.3
2.1
0.1
0.1
1.1
1.0
VIP Industries
Neutral
348
-
4,921
1,450
1,693
10.4
10.5
6.5
7.8
53.2
44.6
11.3
9.8
21.1
22.1
3.4
2.9
Navin Fluorine
Neutral
703
-
3,467
945
1,154
22.4
22.6
28.7
34.8
24.5
20.2
4.1
3.5
-
-
3.2
2.5
Source: Company, Angel Research; Note: *December year end; #September year end; &October year end; Price as on November 27, 2017
Market Outlook
November 28, 2017
Research Team Tel: 022 - 39357800
DISCLAIMER
Angel Broking Private Limited (hereinafter referred to as “Angel”) is a registered Member of National Stock Exchange of India
Limited,Bombay Stock Exchange Limited and Metropolitan Stock Exchange Limited. It is also registered as a Depository Participant with
CDSL and Portfolio Manager with SEBI. It also has registration with AMFI as a Mutual Fund Distributor. Angel Broking Private Limited is a
registered entity with SEBI for Research Analyst in terms of SEBI (Research Analyst) Regulations, 2014 vide registration number
INH000000164. Angel or its associates has not been debarred/ suspended by SEBI or any other regulatory authority for accessing
/dealing in securities Market. Angel or its associates/analyst has not received any compensation / managed or
co-managed public offering of securities of the company covered by Analyst during the past twelve months.
This document is solely for the personal information of the recipient, and must not be singularly used as the basis of any investment
decision. Nothing in this document should be construed as investment or financial advice. Each recipient of this document should make
such investigations as they deem necessary to arrive at an independent evaluation of an investment in the securities of the companies
referred to in this document (including the merits and risks involved), and should consult their own advisors to determine the merits and
risks of such an investment.
Reports based on technical and derivative analysis center on studying charts of a stock's price movement, outstanding positions and
trading volume, as opposed to focusing on a company's fundamentals and, as such, may not match with a report on a company's
fundamentals. Investors are advised to refer the Fundamental and Technical Research Reports available on our website to evaluate the
contrary view, if any.
The information in this document has been printed on the basis of publicly available information, internal data and other reliable
sources believed to be true, but we do not represent that it is accurate or complete and it should not be relied on as such, as this
document is for general guidance only. Angel Broking Pvt. Limited or any of its affiliates/ group companies shall not be in any way
responsible for any loss or damage that may arise to any person from any inadvertent error in the information contained in this report.
Angel Broking Pvt. Limited has not independently verified all the information contained within this document. Accordingly, we cannot
testify, nor make any representation or warranty, express or implied, to the accuracy, contents or data contained within this document.
While Angel Broking Pvt. Limited endeavors to update on a reasonable basis the information discussed in this material, there may be
regulatory, compliance, or other reasons that prevent us from doing so.
This document is being supplied to you solely for your information, and its contents, information or data may not be reproduced,
redistributed or passed on, directly or indirectly.
Neither Angel Broking Pvt. Limited, nor its directors, employees or affiliates shall be liable for any loss or damage that may arise from
or in connection with the use of this information.